Information Inspiration
I developed and taught this course at China Academy of Art in 2019
This course investigates the use of data as a basis for creating artwork. Rather than focussing on traditional infographic design, we asked students to consider the act of translating information into aesthetic form as a creative process in and of itself. In boiling down the process into simple elements of input, translation, and output, we were then unlimited in terms of form and medium. For instance, the examples discussed in class ranged from artists such as Maya Lin, a sculptor who uses geographic data in her work, to Brian Foo, a sound artist who uses information to produce music, to Mona Chalabi, who uses hand drawn illustration techniques to convey complex statistical information. Students were encouraged to think about how the various ways of translating information can create different understandings, experiences, and aesthetic forms. This variety was reflected in the students' work as well.
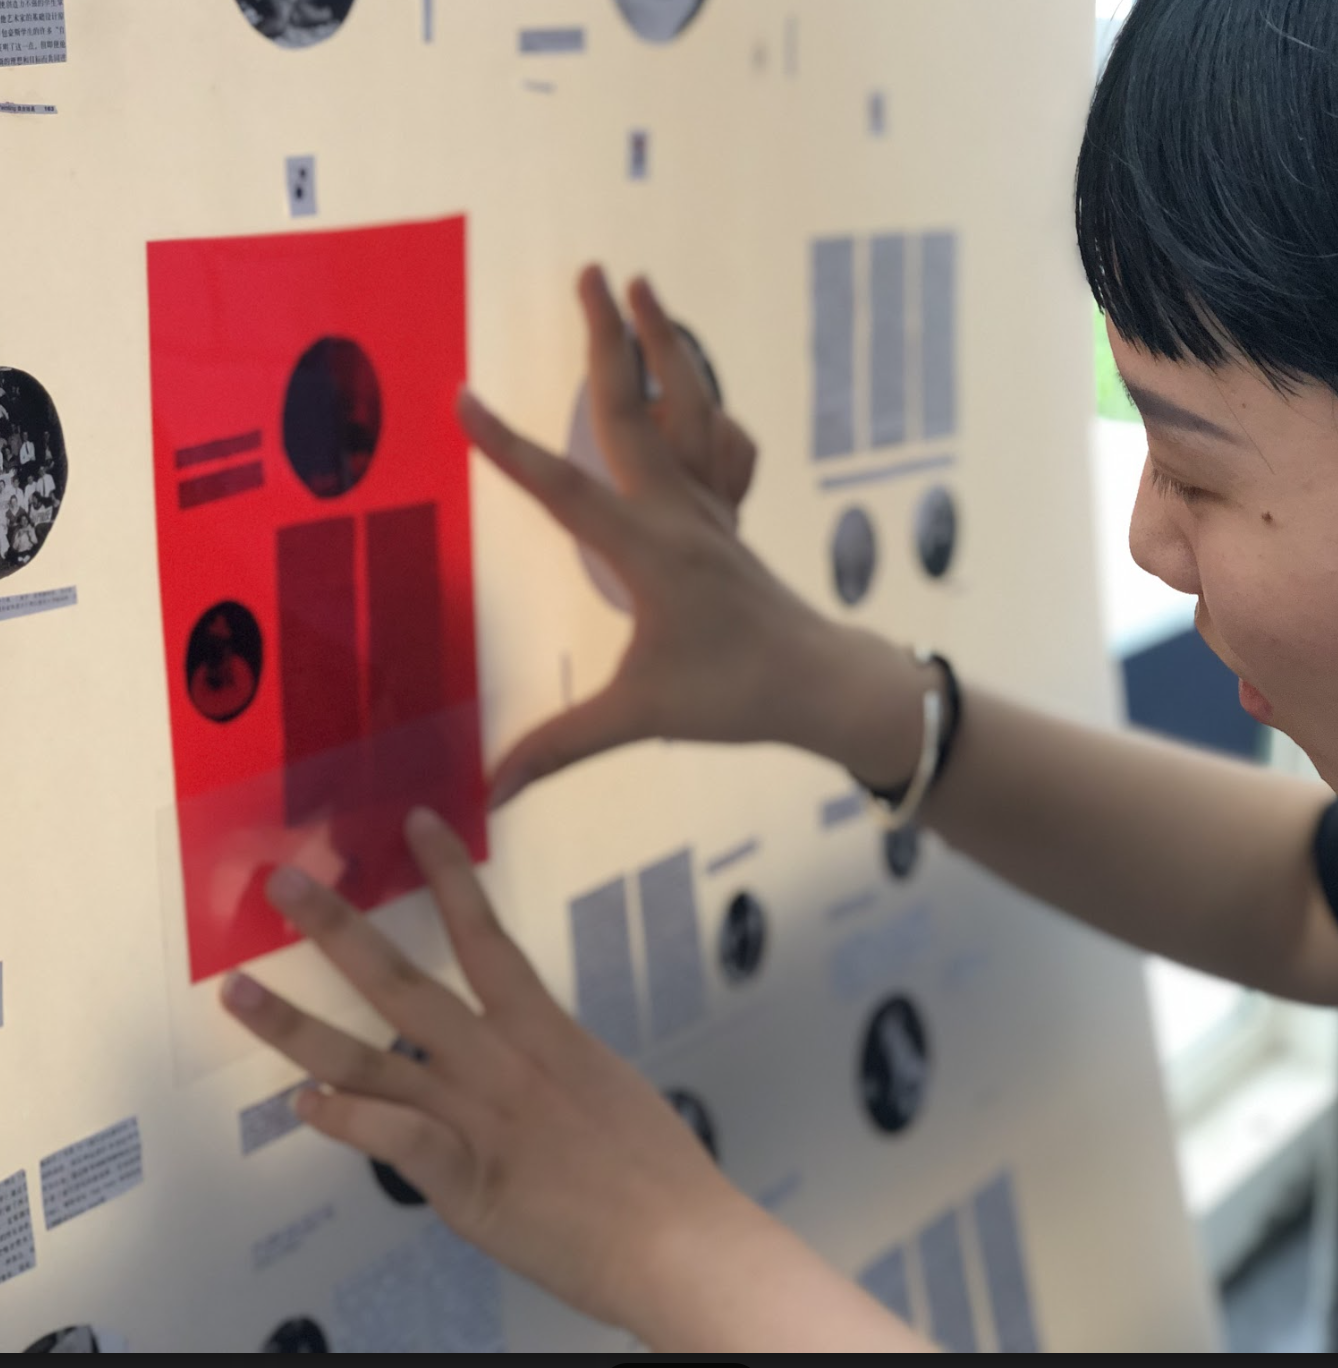
Although exploration of different mediums was encouraged during the course, for the very first week, students were purposefully limited to hand-collected data and also hand-drawn visualization. This limitation was meant to narrow the students' focus on the process of collecting information as well as the relationship between subject matter and aesthetic representation. The very first assignment involved students in groups of two or three going out of the classroom environment and hand-collecting data through observation. This exercise resulted in many interesting methodologies. Some student groups came up with a set of questions and conducted interviews with strangers passing by, while another group looked at the natural environment, collecting leaves and plant samples. Many groups used their phones as recording devices, such as using the camera to capture elements of the campus architecture. Students were then asked to translate this data into drawings. For the second assignment that week, students repeated this process of collecting and drawing data, but were instead asked to focus on data that would reveal something about themselves. Students conveyed information about their hometowns, their habits, their families and personalities. These collection activities encouraged students to think about the act of collecting data as a creative process and also to think about the wide range of information or observations that can be considered as "data."
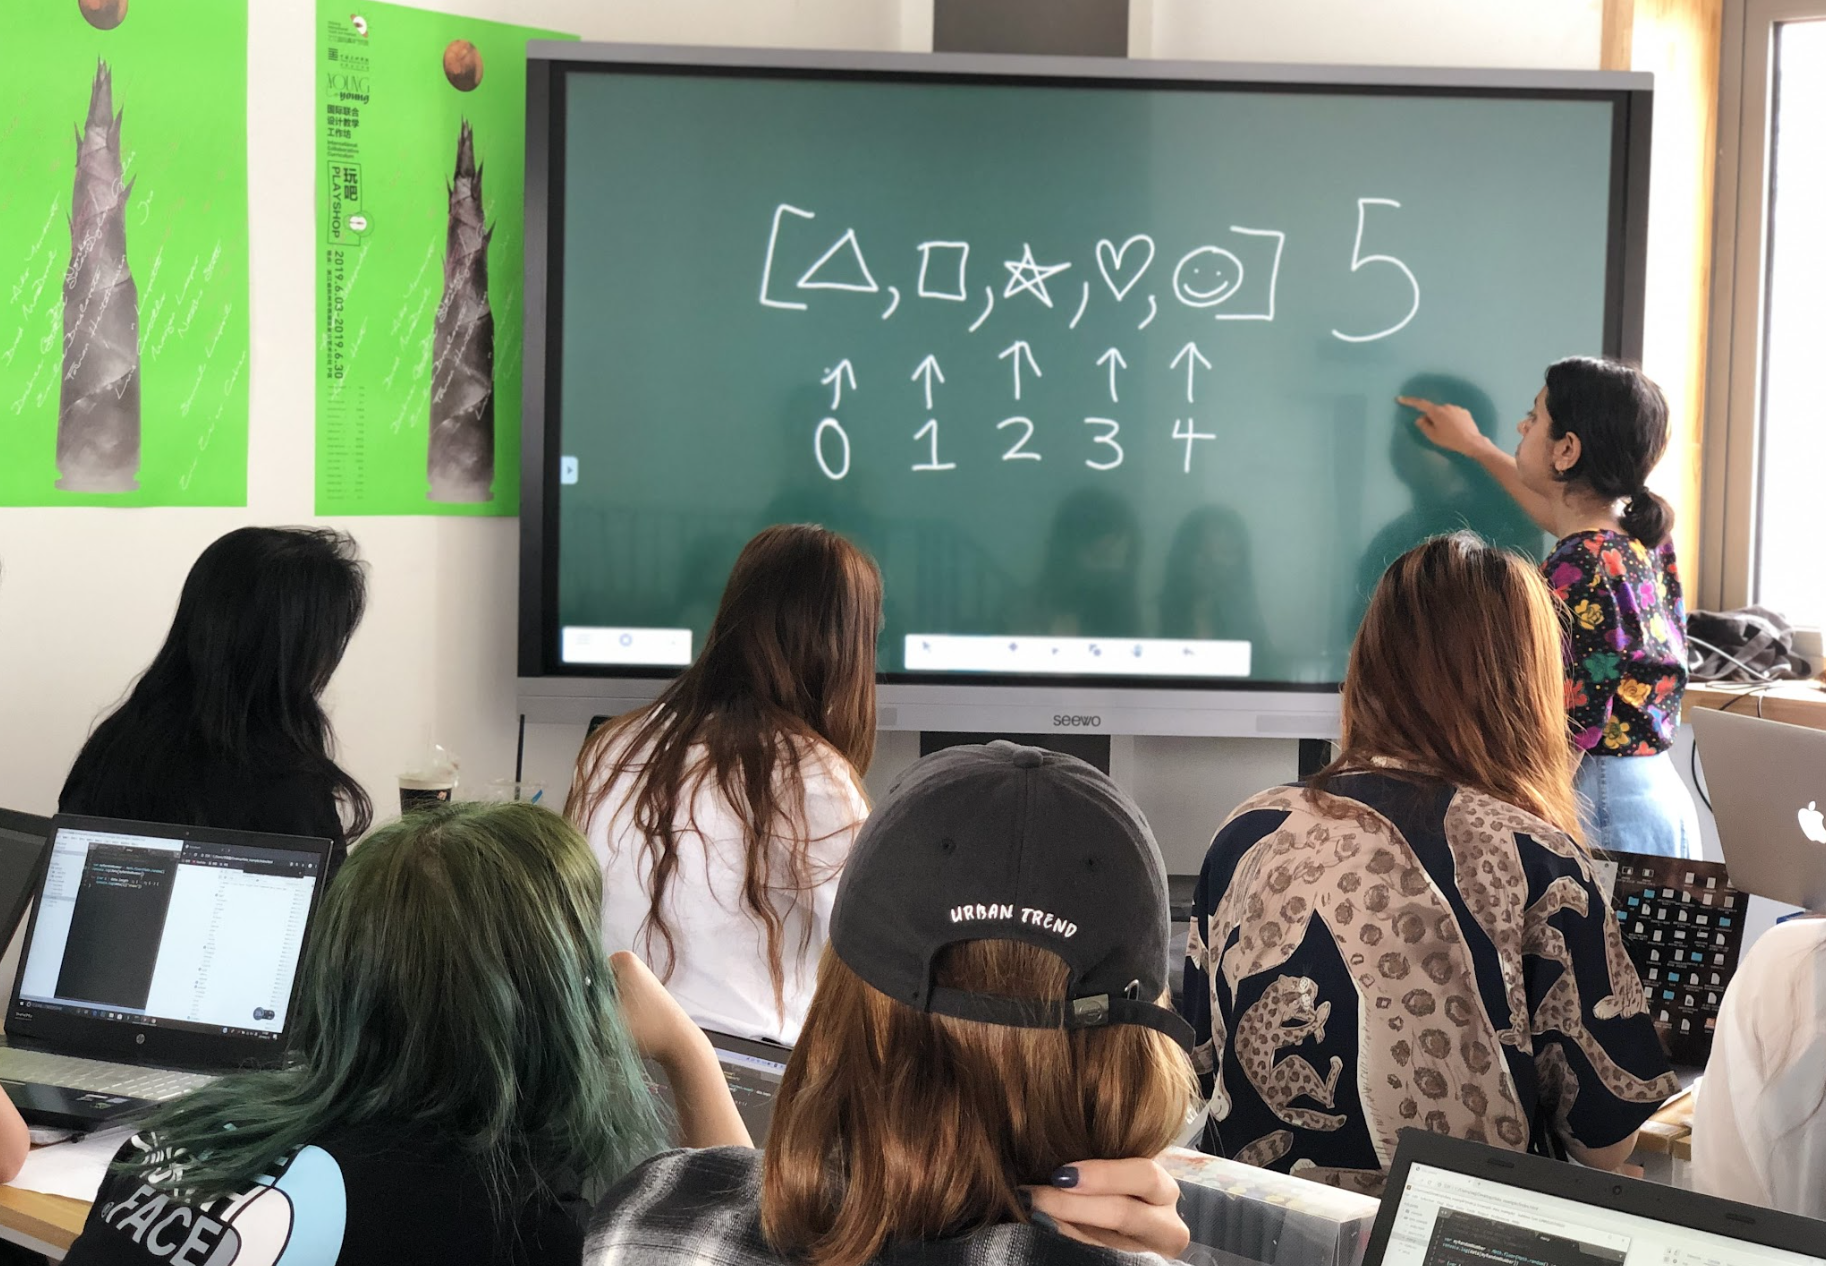
The second part of this course focused on computational methods of visualizing data. Students were provided a sample dataset to work with and taught basic HTML, CSS, and Javascript. The focus on coding during this time was not just about learning coding as a tool, but more about encouraging students to think of the translation process as building a set of rules or parameters that can be tweaked in order to produce different forms. Coding is, in its essence, about logic and rulesets, and so in having the students code, they had to shift their mindset towards this kind of parametric process, which was very much reflected in the final projects regardless of whether coding was used or not.
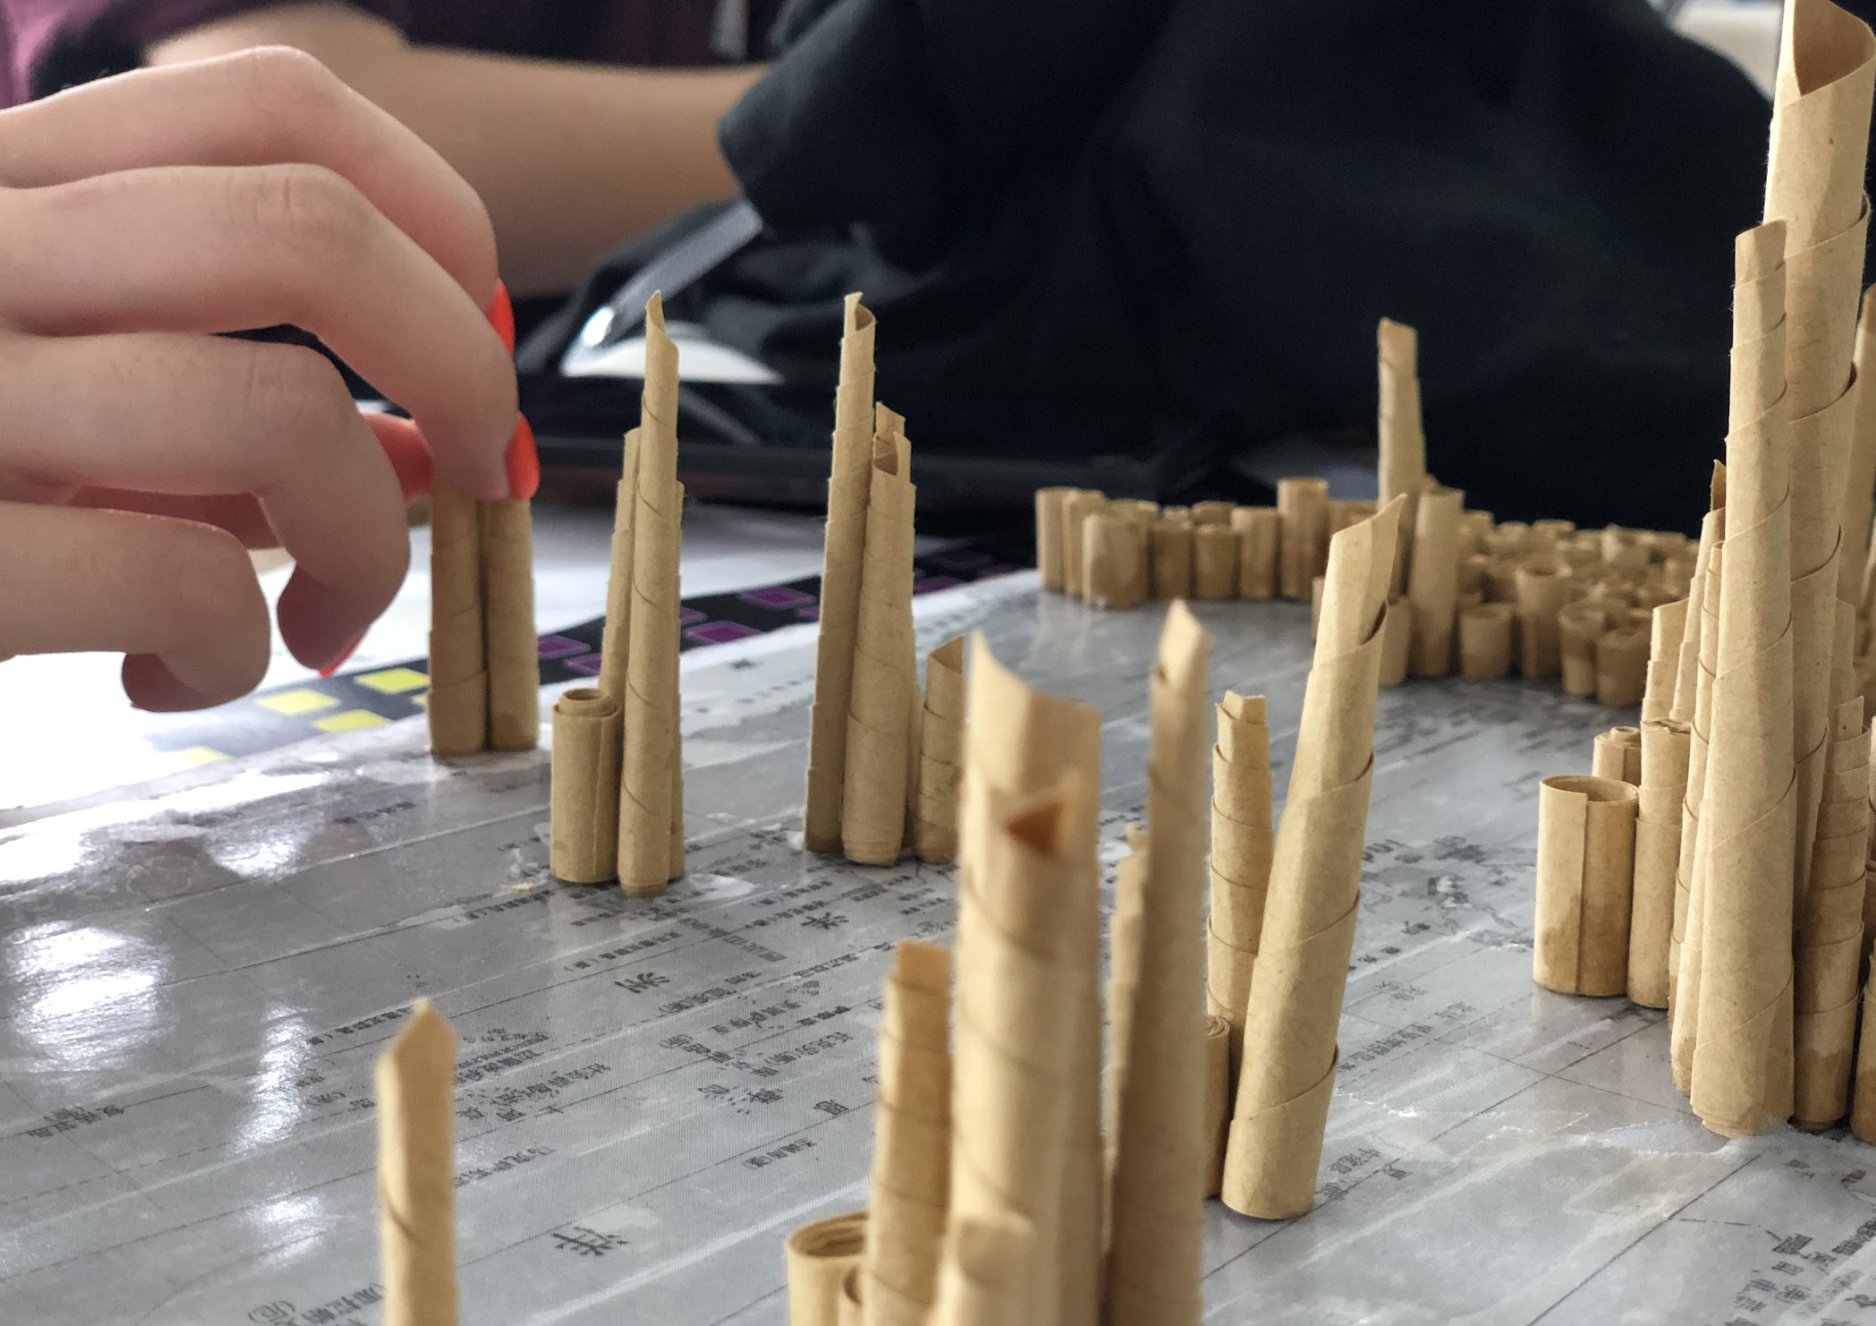
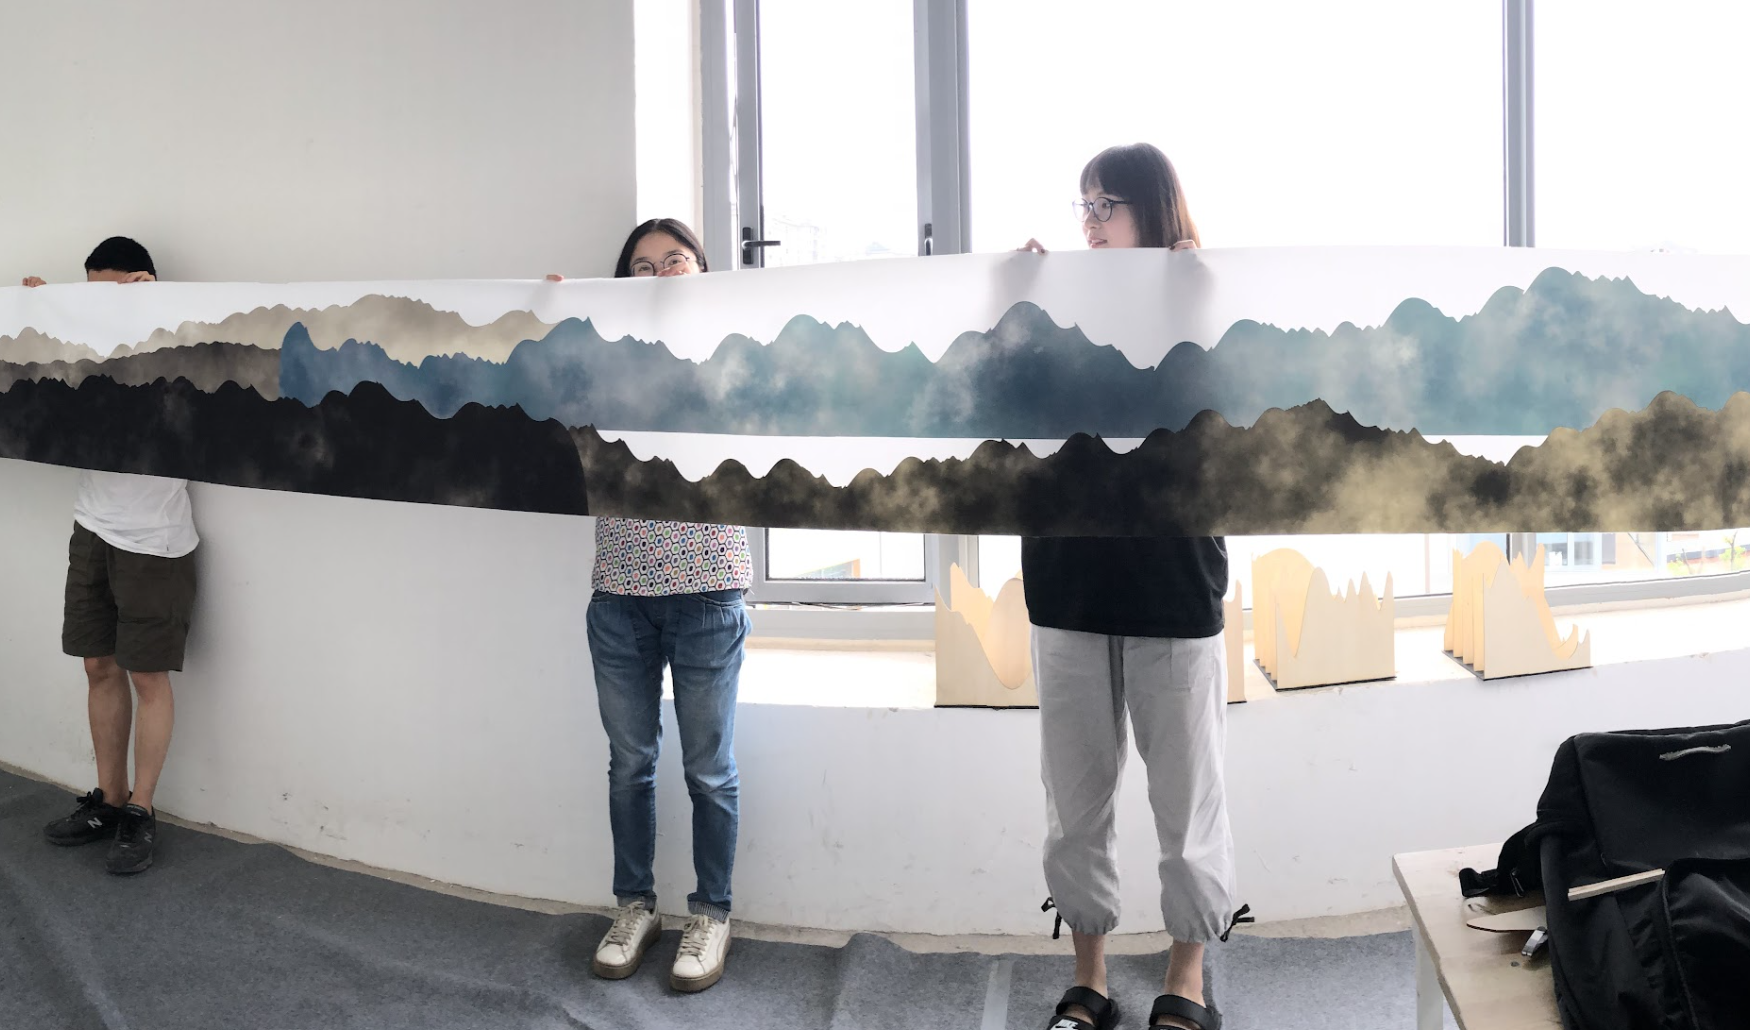
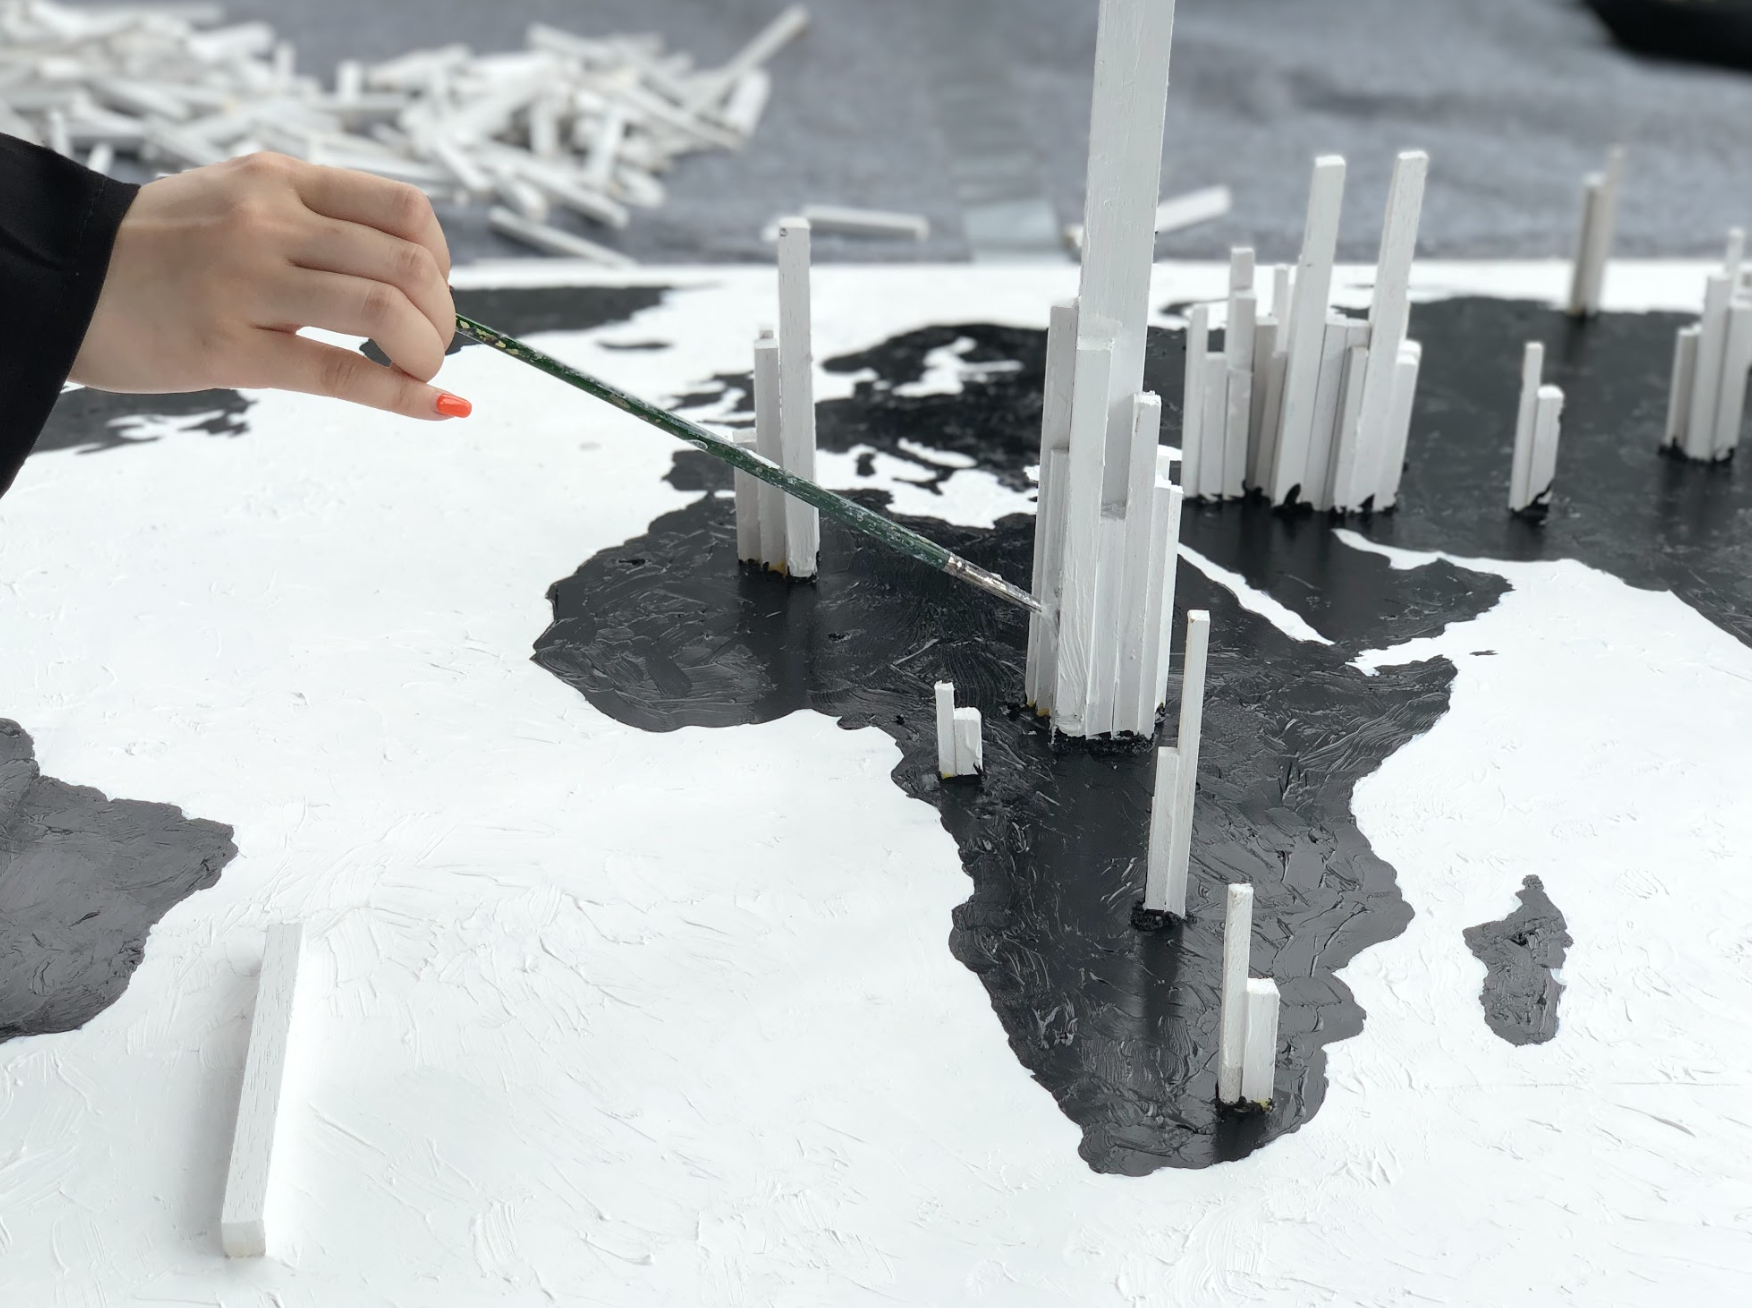
For the final project, students were placed into eight different groups. Each group picked, or in some cases, produced a dataset they were interested in and developed a unique concept around the form and methodology of their visualization. The final prompt was quite open, leading to a large variety in work. The two major conditions of the final project were that students provided a clear explanation of the dataset they used and that they provided a diagrammatic explanation of how they translated this information to produce the final form.
Back to all projects